Introduction
Recommender Systems are algorithms designed to make suggestions of items to users of a certain platform based on their previous patterns. They are used in the tech industry by companies such as Netflix, YouTube, Facebook, Amazon, Expedia, Spotify and so on. More recently, recommender systems have become more diffuse and are not limited to big tech companies, but virtually every company can create its own system (with the right dataset).
The benefits of using such systems are enormous, as described here, here and here. In a nutshell, it can drive traffic, deliver personalised content, enhance customer engagement, increase sales and much more.
The architecture of the recommendation engine is dependent on the business domain and the attributes of the dataset at one’s disposal. For instance, customers on eBay frequently provide ratings for products scaling on 1 (unhappy) to 5 (very happy). Spotify holds information about the gender of music one listens to. Uber eats should know what your favourite type of food is. Instagram has user patterns of likes in images. Such data sources document interactions between users and products (items). In addition, the platform may access personal information from users, such as their location, age, sex and so on. Not to mention the complete metadata of their items. There are three especially common methods to design a recommender system: Collaborative Filtering, Content-based Filtering and hybrid techniques. Content-based systems aim to make recommendations based on some previous information about the customer and the products. For instance, if Netflix knows you like drama movies, it might recommend you movies of this gender. However, in a collaborative filtering approach, it might simply ignore the gender of the film. The features used in this case are exclusively users rating patterns. For instance, if you watched five different series on Netflix and have rated five each of them, just like some other random user, then you might be interested to know what else he has rated as five stars. Hybrid systems make use of both techniques.
In this project, we will use of Alternating Least Square Matrix Factorization, a Collaborative Filtering algorithm. We will build a recommender system for restaurants in the city of Toronto.
Requirements:
- Python
- Apache Spark
Import Libraries and Initialize spark session
!pip install pyspark
#import libraries
from pyspark import SparkContext
from pyspark.ml.recommendation import ALS
from pyspark.sql import SparkSession ,Row
from pyspark.sql.functions import col
from pyspark.sql import SQLContext
from pyspark.ml.feature import StringIndexer
from pyspark.ml import Pipeline
from pyspark.ml.evaluation import RegressionEvaluator
from pyspark.sql.types import StructType,StructField,IntegerType
import matplotlib.pyplot as plt
%matplotlib inline
appName="Collaborative Filtering with PySpark"

#initialize the spark session
spark = SparkSession.builder.appName(appName).getOrCreate()

#get sparkcontext from the sparksession
sc = spark.sparkContext
sqlContext = SQLContext(sc)
Load Dataset in Apache Spark
Dataset
We will be working with yelp dataset. It contains millions of reviews of businesses across the world. We will limit ourselves to the restaurants in the city of Toronto, Canada. The relevant files for us are the following:
yelp_academic_dataset_business.json:Contains information about every review made every customer for every business (millions of reviews).
yelp_academic_dataset_review.json: Contains multiple characteristics from businesses such as parking available, type of food, etc.
Spark SQL
Since we are working with json files we use the function read.json. It takes a json file and transform it to a dataframe. We use sqlContextfrom the module Spark SQL. Spark SQL is a Spark module for structured data processing. It allows use to perform SQL queries in dataframes such as join, groupby, select and so on.
df_business = sqlContext.read.json('../input/yelp-dataset/yelp_academic_dataset_business.json')
df_review = sqlContext.read.json('/kaggle/input/yelp-dataset/yelp_academic_dataset_review.json')
Filter Rows and columns
Our dataset contains many columns, and most of them won’t be used in this project. From the table df_business, we want only the essential features of businesses such as the id, name, stars, category and so on. We are exclusively interested in companies that are restaurants and in the city of Toronto. Therefore we apply the function filter in the columns city and category to enforce this restriction. From the table df_review, we want only the reviews from the selected table above. We use an inner join of df_review and df_business to eliminate all other businesses from the table reviews.
df_business = df_business.select("business_id","name", "stars",
                                 "review_count", "attributes",
                                 "categories", "city").withColumnRenamed("stars", "stars_restaurant")

df_business = df_business.filter((df_business['city'] == 'Toronto') & (df_business.categories.contains('Restaurants'))).drop('city')
df_review = df_review.join(df_business, on='business_id', how='inner')
Lets make a quick visualisation to the basic elements of our review table.
df_review.select(['business_id', 'user_id', 'stars']).show()
+--------------------+--------------------+-----+
|         business_id|             user_id|stars|
+--------------------+--------------------+-----+
|qUWqjjjfpB2-4P3He...|TZQSUDDcA4ek5gBd6...|  4.0|
|9Eghhu_LzEJgDKNgi...|iFEM16O5BeKvf_AHs...|  3.0|
|cDoo0Pf1d_P79Rq3Z...|1kNsEAhGU8d8xugMu...|  3.0|
|4m_hApwQ054v3ue_O...|Eg_VTAQwK3CxYTORN...|  5.0|
|jM6JjZXFAQQANwdlE...|IIE2OX5haarGNefY2...|  5.0|
|PMPMHHLe9vFzcR67i...|RRhco4irDXPk5EJmv...|  5.0|
|IfUkm42SB9D0m_Zbk...|Kl6jNDAE7PG_VVQaf...|  4.0|
|NrJSy3dgcXErFtOKG...|is1nHZ4oBqqmBm_mf...|  4.0|
|nY2oBwH3s5sKox1mE...|JnPIjvC0cmooNDfsa...|  5.0|
|tWdp26XQEJqJGnRmF...|IeojscL3rg3x3vtmR...|  4.0|
|tJcpzXzykNSLuzWwa...|6WmMHMBM4FLGyK98-...|  1.0|
|PjtX-5vSTBVyWfMRE...|pMefTWo6gMdx8WhYS...|  4.0|
|28adZ4lsuUeVB2aWz...|BwwqlPVsJk1dbUyNw...|  5.0|
|tvYID0arhN-shKGUr...|kmOvnwtroMBC8y9lO...|  1.0|
|sSdHUsUZ4mvkb5ymI...|0aHFybE0id9DD97Qz...|  4.0|
|n-5dPbGyziS0SOkVD...|Fw8Lj7q7DqTh-m3hG...|  4.0|
|0a1BBSewiusfCalA9...|hYnq9-wO-RzmiTTGM...|  4.0|
|uG0yvj2JWfCf0eaIg...|yiLiYYg6MM7Pmuo6j...|  5.0|
|4POPYEONJpkfhWOMx...|vxf427mKFMUxpfbHC...|  2.0|
|w7DEm_2Gj_xF0qeRd...|BOmBm4j0r2JPqi6V6...|  4.0|
+--------------------+--------------------+-----+
only showing top 20 rows
Exploratory Data Analysis
Let’s have a quick visualisation of the data. We plot a histogram of the ratings from users.
However, to make visualisations we have to convert the data from dataframe (pyspark) to pandas. First we use the .collect() and later we extract the the values.
reviews = df_review.select('stars').collect()
review_list = [reviews[i][0] for i in range(len(reviews))]

plt.hist(review_list, bins=[0.5,1.5,2.5,3.5,4.5,5.5], alpha=0.5,
         histtype='stepfilled', color='steelblue',
         edgecolor='none')
plt.ylabel('Frequency')
plt.xlabel('Rating')
plt.style.use('seaborn-white')
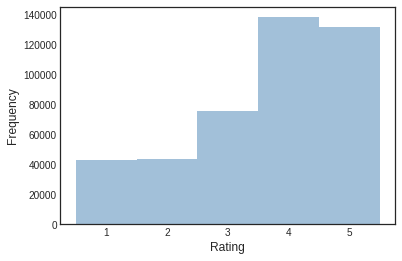
Quite generous public from Toronto. Most ratings are above 3. Now let’s see the distribution of ratings of each restaurant.
restaurant_reviews = df_business.select('stars_restaurant').collect()
restaurant_reviews_list = [restaurant_reviews[i][0] for i in range(len(restaurant_reviews))]


plt.hist(restaurant_reviews_list, bins=[0.5,1.5,2.5,3.5,4.5,5.5], alpha=0.5,
         histtype='stepfilled', color='steelblue',
         edgecolor='none')
plt.ylabel('Frequency')
plt.xlabel('Rating')
plt.style.use('seaborn-white')
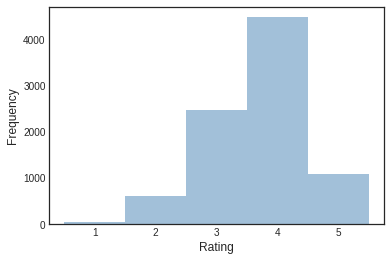
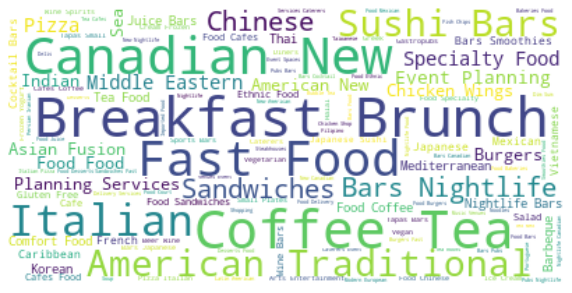
Here were see a more normally distributed curve. Aditionally we can see that most restaurants do pretty well in terms of average rating. Now let’s visualise what the most popular type of restaurants in Toronto are. What kind of food do they serve? We will create a word cloud.
restaurant_categories = df_business.select('categories').collect()
restaurant_categories_list = [restaurant_categories[i][0] for i in range(len(restaurant_categories))]
text = " ".join(review for review in restaurant_categories_list)
from wordcloud import WordCloud, STOPWORDS, ImageColorGenerator

# eliminate useless words
text = text.replace('Restaurants', "")
text = text.replace('bars', "")
text = text.replace('food', "")


# Generate a word cloud image
wordcloud = WordCloud(background_color="white").generate(text)

# Display the generated image:
# the matplotlib way:
plt.figure(figsize=(10,8))
plt.imshow(wordcloud, interpolation='bilinear')
plt.axis("off")
plt.show()
Convert String to index
Before starting the modelling process, we must convert all columns that will be used in the model to integer. This is compulsory for the ALS model from PySpark. The columns that need to be converted are the business_id and user_id.
We use the StringIndexer function imported in from pyspark.ml.feature.
indexer = [StringIndexer(inputCol=column, outputCol=column+"_index") for column in ['business_id', 'user_id']]
pipeline = Pipeline(stages=indexer)
transformed = pipeline.fit(df_review).transform(df_review)
transformed.select(['business_id', 'user_id','business_id_index', 'user_id_index'])
Split Dataset in train and test
(training, test) = transformed.randomSplit([0.8, 0.2])
Create ALS model
Alternating Least Square is a matrix factorisation algorithm implemented in Apache Spark ML and built for large-scale collaborative filtering problems.
Matrix factorization (or decomposition)
The basic idea is to decompose a matrix in smaller parts in the same way we can do for a number. For instance, we can say that the number four can be decomposed in two times two (4 = 2 x 2). In the same way, we can do a decomposition of a matrix.
Here is an example of how can we decompose a matrix that has ratings for restaurants by clients: 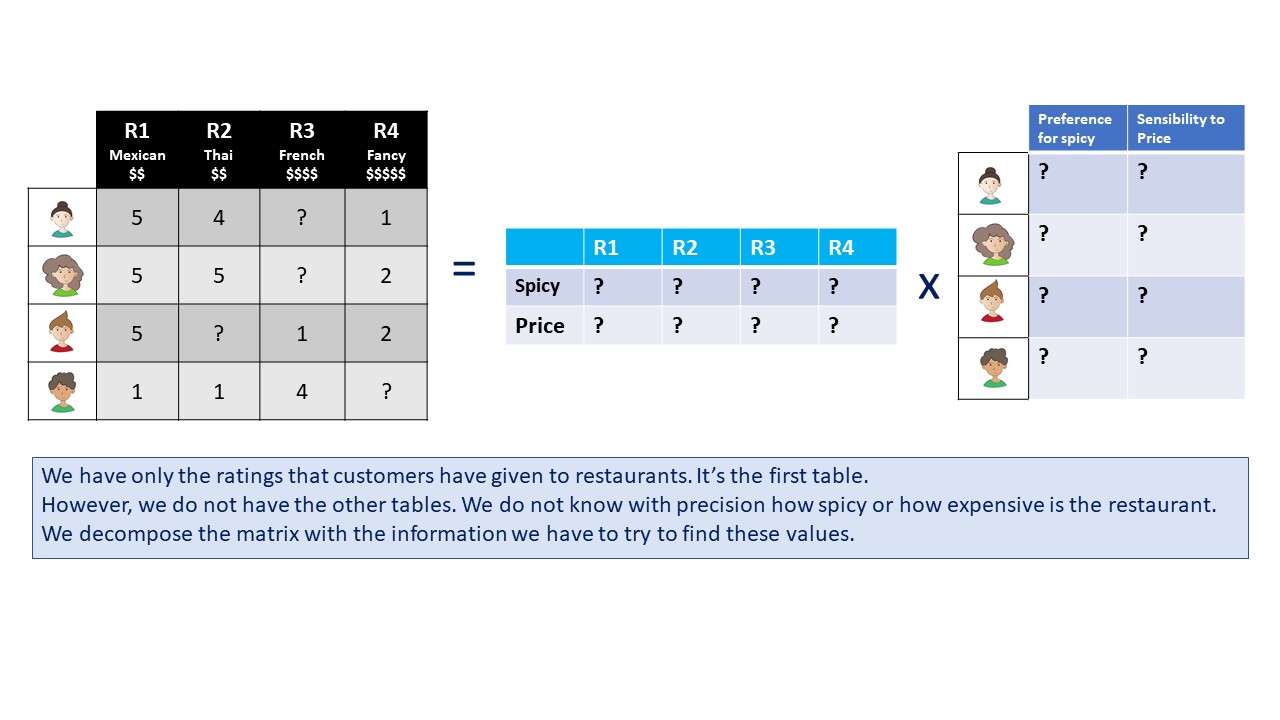
If we are able to find the hidden matrices, we will be able to calculate the expected rating that every client will give to each restaurant. This is our goal with the algorithm.
But how to find the hidden matrices?
The math in this process is extensive and is not our goal to discuss it in here. You can read it about in here. It is very a very similar process to the stochastic gradient descent.
Parameters (as described on Spark website)
- numBlocks is the number of blocks the users and items will be partitioned into in order to parallelize computation (defaults to 10).
- rank is the number of latent factors in the model (defaults to 10).
- maxIter is the maximum number of iterations to run (defaults to 10).
- regParam specifies the regularization parameter in ALS (defaults to 1.0).
- implicitPrefs specifies whether to use the explicit feedback ALS variant or one adapted for implicit feedback data (defaults to false which means using explicit feedback).
- alpha is a parameter applicable to the implicit feedback variant of ALS that governs the baseline confidence in preference observations (defaults to 1.0).
- nonnegative specifies whether or not to use nonnegative constraints for least squares (defaults to false).
als=ALS(maxIter=5,
        regParam=0.09,
        rank=25,
        userCol="user_id_index",
        itemCol="business_id_index",
        ratingCol="stars",
        coldStartStrategy="drop",
        nonnegative=True)

model=als.fit(training)
Evaluate RMSE
evaluator=RegressionEvaluator(metricName="rmse",labelCol="stars",predictionCol="prediction")
predictions=model.transform(test)
rmse=evaluator.evaluate(predictions)
print("RMSE="+str(rmse))
RMSE=1.3651734482322269
Our model is doing pretty well. We have achieved a 1.36 average squared error. Lets see an applied case of a recommendation for a customer.
In future works we can include a step of parameter tunning as in here.
Visualize Recommendations
Now we visualise recommendations for user 30 (could be any other).
test = model.recommendForAllUsers(20).filter(col('user_id_index')==30).select("recommendations").collect()
topRestaurants = []
for item in test[0][0]:
    topRestaurants.append(item.business_id_index)

schema = StructType([StructField("business_id_index",IntegerType(),True)])
restaurants = spark.createDataFrame(topRestaurants,IntegerType()).toDF("business_id_index")


transformed\
.select(['business_id', 'user_id', 'stars', 'categories'])\
.filter(col('user_id_index')==30)\
.show()

restaurants\
.join(transformed, on = 'business_id_index', how = 'inner')\
.select(['business_id', 'stars', 'categories', 'name'])\
.drop_duplicates(subset=['name'])\
.show()
+--------------------+--------------------+-----+--------------------+
|         business_id|             user_id|stars|          categories|
+--------------------+--------------------+-----+--------------------+
|9XLH_grfIYKR7d5ZT...|i6V3NyTdkBVwPpH7r...|  2.0|Restaurants, Ital...|
|A7waf6G3cvnLfAqKe...|i6V3NyTdkBVwPpH7r...|  2.0|Restaurants, Italian|
|kuJRRmmmDUXqwM6kN...|i6V3NyTdkBVwPpH7r...|  4.0|Nightlife, Food, ...|
|aEnoF_79jQE83s-I7...|i6V3NyTdkBVwPpH7r...|  3.0|Food, Restaurants...|
|d4bVdEDwxmyB0M-w5...|i6V3NyTdkBVwPpH7r...|  4.0|Breakfast & Brunc...|
|28adZ4lsuUeVB2aWz...|i6V3NyTdkBVwPpH7r...|  5.0|Bars, Food, Gastr...|
|cTbFJzHQzFSX-z3JF...|i6V3NyTdkBVwPpH7r...|  4.0|Restaurants, Amer...|
|eQCYur0033RkZdh5V...|i6V3NyTdkBVwPpH7r...|  3.0|Italian, Breakfas...|
|Ycp3Agr7dt71TZkeK...|i6V3NyTdkBVwPpH7r...|  3.0|French, Breakfast...|
|7HrCELR6uv2HkgL7a...|i6V3NyTdkBVwPpH7r...|  2.0|Restaurants, Seaf...|
|sHXIiGercy22UVpwM...|i6V3NyTdkBVwPpH7r...|  4.0|Comfort Food, Nig...|
|nDn2h-_c7Xk4UwM0a...|i6V3NyTdkBVwPpH7r...|  4.0|Mediterranean, Gr...|
|Cx0o524EbpLh8Luvj...|i6V3NyTdkBVwPpH7r...|  5.0|Mediterranean, Mi...|
|K5Q2vkF5UpytV9Q1r...|i6V3NyTdkBVwPpH7r...|  5.0|Restaurants, Japa...|
|lCwUmc0IEhIMz7lyZ...|i6V3NyTdkBVwPpH7r...|  5.0|Restaurants, Vege...|
|siaRCT2-PkyeXUVKr...|i6V3NyTdkBVwPpH7r...|  3.0|Restaurants, Chin...|
|O66Zy8Y13VBm72ZDh...|i6V3NyTdkBVwPpH7r...|  4.0|American (New), R...|
|KuIxm6FVNmlvpssWJ...|i6V3NyTdkBVwPpH7r...|  4.0|Mediterranean, Gr...|
|I2nw7LGLSHN4uUgnH...|i6V3NyTdkBVwPpH7r...|  3.0|American (New), F...|
|Ww-qDl1G9Kr7igS3o...|i6V3NyTdkBVwPpH7r...|  5.0|Restaurants, Amer...|
+--------------------+--------------------+-----+--------------------+
only showing top 20 rows

+--------------------+-----+--------------------+--------------------+
|         business_id|stars|          categories|                name|
+--------------------+-----+--------------------+--------------------+
|3VuAagJSUzWDgisd4...|  4.0|Canadian (New), B...|                Fuse|
|TiQBE6BdjSg9MF3UC...|  5.0|Indian, Sri Lanka...|         New Kalyani|
|nVFZTB3uwW_NkAlqI...|  5.0|Restaurants, Cate...|         Latte Booth|
|zNCGTEwBrmrVLfjxl...|  5.0|Desserts, Cafes, ...|Ballissimo Loukou...|
|MTneG8wJrUxIzIfnH...|  5.0|Event Planning & ...|   Baby Point Lounge|
|xUsYf7lB0bi1zGEw4...|  5.0|Food, Barbeque, F...|Stoke Stack Barbecue|
|rdWy6OF9QldlIxlYV...|  4.0|Restaurants, Pers...|              Tabriz|
|eohcbvMCGegrUCDnj...|  5.0|Thai, Restaurants...|     Qinthai Cuisine|
|58pzEN_yy2hjPjtml...|  1.0|Restaurants, Fili...|     Kalesa Restobar|
|ScdakSPeGerwzJu2D...|  5.0|Pakistani, Indian...|      Shalimar Grill|
|Q0fQ5FRT0ug80Vk9X...|  5.0|Cocktail Bars, Re...|     Viajero Cantina|
|GFBiGcIZ8Wqm6wtTL...|  4.0|Restaurants, Chinese|    Taste of Qin Yun|
|fcayaG-BUicxcIZwG...|  5.0|Japanese, Restaur...|                Hiwa|
|Xja69DDoUqbPwFOSB...|  4.0|Restaurants, Pizz...|       Slice N Bites|
|4Nn9QoRDkOr-DWMF7...|  5.0|Portuguese, Resta...|Brasileirissimo S...|
|U7JrKn4fYW2RpJa7N...|  5.0|Restaurants, Cana...|The Carlton Resta...|
|CJq8OmZuScJ1jUUjx...|  5.0|Restaurants, Sush...|          Hoya Sushi|
|sSp-ZbEsVDKf8Y2OA...|  5.0|Cafes, Meat Shops...|   Speducci Mercatto|
|hT5kvnJnBWzUWrSpq...|  5.0|Chicken Wings, Ca...|       The Sky Stars|
|zWgoKXfq75Zhm8qcu...|  4.0|Sandwiches, Fast ...|           Euro Bite|
+--------------------+-----+--------------------+--------------------+